Sunday, April 11, 2021

Oxidative burst

Neutrophils (& monocytes) produce hydrogen peroxide (through superoxide production) to kill phagocytosed bacteria. 

2O2 + NADPH —> 2O2•– + NADP+ + H+

This reaction is catalaysed by NADPH oxidase. A series of reactions then generates hydrogen peroxide from this superoxide radical, and finally hypochlorous acid.

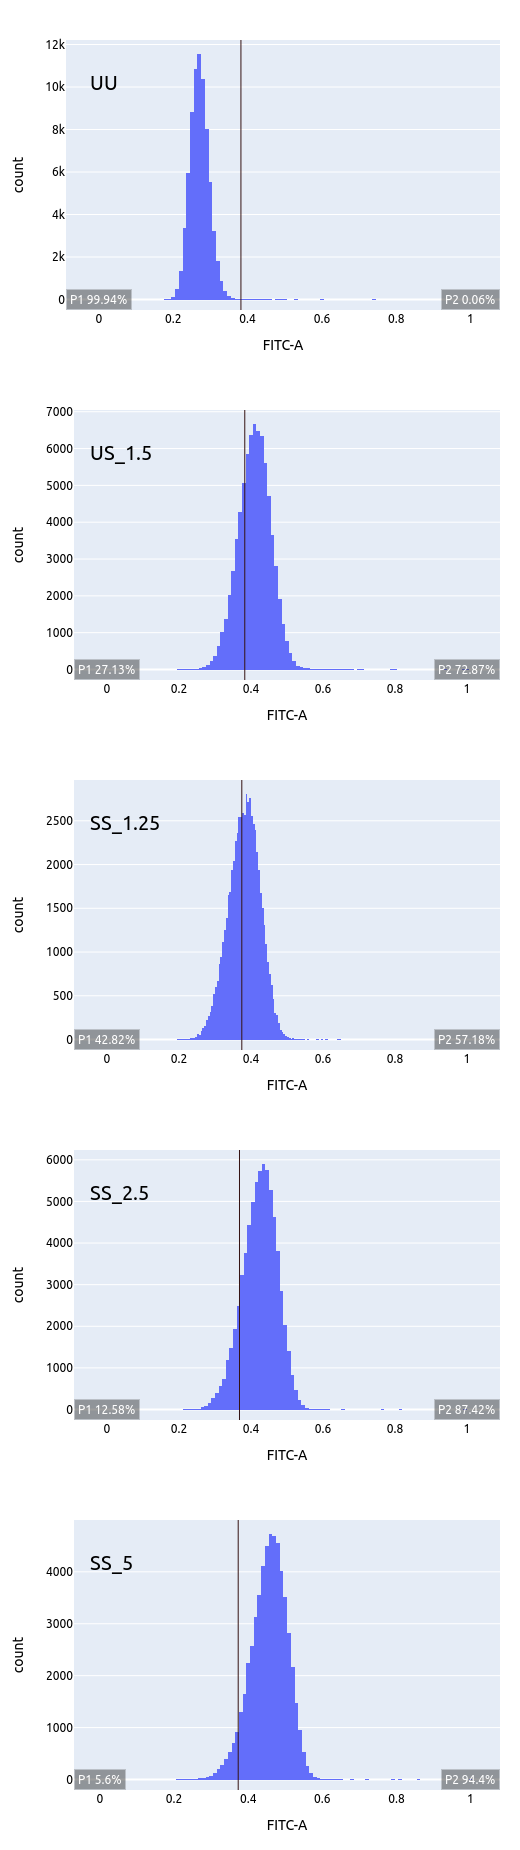
In vitro, this reaction can be visualised by Dihydrorhodamine (DHR), which is oxidised by H2O2 from normal, stimulated neurophils to give fluorescence (in the FITC channel). EDTA/ heparin blood must be used within 2 hours of collection, in room temparature all the time.

Gating neutrophils, lymphocytes and monocytes from whole blood

Before and after stimulation; note presence of DHR peak ('oxidative burst') in neutrophils and monocytes, and not in lymphocytes

The lack of superoxide produces a (weirdly named) disease.

Chronic granulomatous disease

Well, this has got (almost) nothing to do with granulomas (maybe a little, indrectly). This is a defect in several components of NADPH oxidase, resulting in inability to produce hydrogen peroxide. An X linked form (75%) & an autosomal recessive form (25%) occur.

Agent

XR: Mutation in phagocyte NAPH-O complex due to defect in gene for gp91phox.

AR: Defects in genes p47,67,22 phox or RAC2

It manifests as recurrent pyogenic infection with catalase +ve organisms.

Pathology

Three scenarios:

1. Normal neutrophils accumulate H2O2 in the phagosome containing ingested bacterium → MPO (myeloperoxidase) is delivered to the phagosome by degranulation, → H2O2 acts as a substrate for MPO to oxidize halide to hypochlorous acid and chloramines, which then kill the microbes. The quantity of hydrogen peroxide produced by normal neutrophils is sufficient to exceed the capacity of catalase, a hydrogen peroxide-catabolizing enzyme of many aerobic microorganisms.

2. When catalase +ve organisms such as E. coli gain entry into the CGD neutrophils, they are not exposed to hydrogen peroxide because the neutrophils do not produce it, and the hydrogen peroxide generated by microbes themselves is destroyed by their own catalase. Thus catalase-positive microbes, such as E. coli, can survive within the phagosome of the CGD neutrophil.

3. When CGD neutrophils ingest catalase negative organisms such streptococci or pneumococci, the organisms generate enough hydrogen peroxide to result in a microbicidal effect; i.e. they are killed by their own hydrogen peroxide.

(Ref: Williams, Hematology)

Thus there is a preponderane by recurrent infections by Catalse positive organisms.

CGD; note the lack of oxidative burst in stimulated neutrophils


Saturday, April 10, 2021

Foxp3

Titration of FoxP3 (tagged with PE). Note the gradual and slow population shift over increasing doses of antibody.  (UU - unstimulated unstained, US - unstimulated stained, SS - stimulated & stained)

As the dose of antibody is inreased, the entire helper T cell population is taking up the stain (which is unwanted behavior)

There is no drop in median PE expression with doses upto 10 microL. This means there might be yet more antibody targets left to bind


In this case, 2.5 miroL dose which gives good positive population (2.86%) without staining the negative population. So we select this dose.

Antibody clone: 236A/E7, FoxP3 - PE

Transforming growth factor beta 1

Titration of anti TGFB1 antibody

Without stimulation

Titration plots for increasing doses of anti-TGFB1. Note the vertical line drawn at unstained (UU) and successive population shifts (non specific binding?). The ideal dose in this case must be close to 0.625 microL.

Doses ranging from 0.625 to 10 microL; note that entire cell population is moving

Plotting median FITC versus dose shows a continuously increasing trend. so no help from there!

With antigenic (MTb) stimulation

Does not make much of a difference


Thus, still undecided on the dose.

(Antibody clone TW4-9E7 bound to Alexa fluor 488, detected on FITC channel; cells - healthy peripheral blood mononuclear cells).


Tuesday, February 23, 2021

Titrating antibodies for flow cytometry

To determine the optimal dose of an antibody (which will bind cells at just the right proportion to generate a signal which is measurable within the limits of the lasers of the machine) is an exercise in perseverence. One must prepare serial dilutions of the antibody, isolate cells from blood (in this case, lymphocytes) and go on staining with each dilution of antibodies. 

Here, anti human FoxP3 has been prepared at doses of 5, 2.5, 1.25 and 0.625 microL (to stain one million cells, in each case). FoxP3 is a transcription factor expressed by a select set of T lymphocyte only upon stimulation by some external antigen. The graphs show staining intensity of the fluorochrome (in this case, phycoerythrin) as a histogram of cell counts, indicating expressionof FoxP3 inside the cells. Shift in median staining intensity has started to appear from 2.5 microL onwards. Note the difference between
  • peaks of unstained cells (blue) and unstimulated cells (green), as expected
  • peaks of stained cells, with increasing concentrations of antibodies, shown in progressively redder colors

The axis is logarithmic, so the differences between peaks are really much more than they seem

... as evident from the mean and median statistics (see legend of plot)

IL-17, the cytokine of acute inflammation, shows only a moderate increasewith stimulation.
Without stimulation, without staining for any antibody
Without stimulation, but with staining for any background IL-17 present

With stimulation; note the scattered points towards far right (high IL-17 expression)
With a constitutive surface marker like CD4, there is hardly any difference between unstimulated and stimulated
Orange - unstimulated, stained for CD4, green - stimulated and stained, purple- neither stimulated nor stained for CD4


Thanks Uddeep and Dr Abhinav Saurabh

Saturday, February 13, 2021

Antibody screening for transplant

Screening for preformed antibodies

In solid organ transplant, preventing hyperacute rejection is the primary aim. The recipient serum is tested for antibodies against the commonest HLA antigens in the population ('panel'); however, the sheer number of different HLA antigens (about 15000 and ever increasing) make it a difficult test to be done manually.

In the solid phase bead assay, single/ multiple such antigens are attached to plastic beads and read by a specialised flow cytometer.

No anti-MHC antibodies in recipient serum; transplant can proceed


Non specific antibodies binding to beads, mostly against DQ and DP antibodies; transplant can proceed

High titre of antibodies against MHC Class II (DQ); contraindication to transplantatinon

Very high titre of antibdies against MHC Class I; a definite contraindication to transpant


Sunday, February 7, 2021

Visualising cytokines

Cytokine production by cytotoxic T cells

T cells stimulated with tubercular antigen show a visible increase in the proportion of interferon-gamma producing CD8+ T cells; (flow cytometric data, PE Cy5 = CD8, FITC = IFN gamma)

Before stimulation; note the very small fraction of cells above the horizontal line (i.e. those producing interferon)


After stimulation; 2-4 % of cells have now been activated and moved above the line

The CD8 negative cell population (i.e. left of the vertical line) are a mix of B cells and helper (CD4+) T cells; note that CD4+ T cells will also produce interferons, as seen in the top left quadrant.

Sunday, January 31, 2021

Glial polyp of cervix

33F, a pedunculated polyp noticed in cervix during delivery of baby, 2 x 2 cm; strangely resembling cererbral cortical tissue. Rare, and nobody knows how. One of the most fascinating examples of a hamartoma.


Next generation sequencing: Part 1

 Imagine solving a puzzle with 100 pieces, each piece a centimeter in size, something like this: The genome is considerably larger than this...