Showing posts with label flow cytometry. Show all posts

Sunday, January 30, 2022

Natural killers

Why natural killer cells?

The most recent (evolutionarily) arm of innate immunity, NK cells, were devised to counter a vulnerability in our immune system. The usual scheme of things  - before NK cells -  was something like this: you got your B lymphocytes and antibodies to fight off bacteria and ward off parasites. Viruses, however, often found there way inside cells and colonised cells, effectively turning the cell into some primitive version of a zombie, chrning out baby viruses thousands by the minute. Cellular immunity, i.e. T lymphocytes, eventually found a way to deal with those pesky viruses. Viral particles (antigens) were picked up by a molecule called "MHC class I" and presented to T cells, as a distress signal. The T cell could then recognise that particle, and smelling the rot inside, unleashed its destruction machinery on the cell. The cell dies, and so does the virus inside it, everybody loses. 

All this was done and dusted very early in evolution though, until some smart teenage mutant ninja virus came up with a devilish idea: why don't attack the cell nucleus and turn off the very expression of MHC class I molecules, effectively rendering the infected cell invisible to T lymphocytes. The virus could then safely reside, and multiply (divide?) in the cell, without being 'seen' by T lymphocytes.

The situation continued for a while, until of course, animals one-upped the virus in the arms race. NK cells appeared first in chordates, as an update patch to plug this very hole. NK cells are large lymphocytes which patrol the body and look for MHC class I molecule. The mechanism is really simple: if a cell does not express MHC class I, NK cells assume the worst (that it's an infected cell, or a cancer cell) and kills the cell with its arsenal of enzymes. Really, a no-brainer solution for smart viruses. This has worked well for us throughout evolution, although indiscriminate killing isn't good strategy in the long term (chronic hepatitis and autoimmune diseases, anyone?), as we're only recently beginning to understand.


In normal course of things, cytotoxic T cells (CD8+) have no difficulty in identifying virally infected cells because MHC class I molecules bring out those foreign, viral proteins to the surface

If a virus has learnt to turn of MHC class I expression, it is invisible to T cells; however, the NK cell notices the absence of MHC class I on the surface, and kills the cell

Identifying NK cells

NK cells are identified by their low/ variable expression of CD8 and a multifunctional molecule CD56, also called 'neural cell adhesion molecule' (NCAM).

Initial forward and side scatter plot of peripheral blood mononuclear cells prepared with Lymphoprep; lymphocytes constitute a healthy 29% of mononuclear cells (the debris at the bottom left constitute the other majority)

Within the lymphocytes, distribution of CD8 shows three peaks - the negative ones at the left (possibly helper T cells, B cells and macrophages), a dim population in the middle, and a bright one at the right (cytotoxic T cells); the later two constitute 48% of all lymphocytes


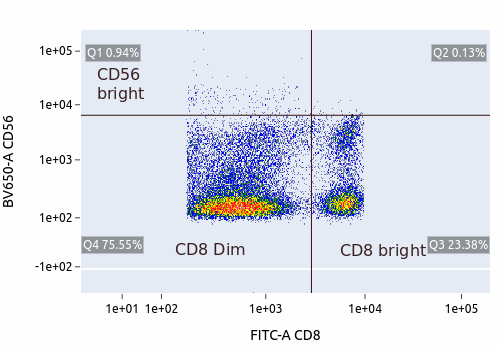
CD56 is expressed at higher levels in the dim population, suggesting that the dim population is where NK cells reside

Majority of NK cells express CD56 only dimly (the ones in the box, which turn around to be 20.62% of CD8+ cells, and 9% of all lymphocytes in this particular case). A few of them show bright  CD56 (above the box)

Ref: William G. Morice, MD, PhD. The Immunophenotypic Attributes of NK Cells and NK-Cell Lineage Lymphoproliferative Disorders. (DOI: 10.1309/Q49CRJ030L22MHLF)

Konstantin Khalturin, Matthias Becker, Baruch Rinkevich, Thomas C. G. Bosch. Urochordates and the origin of natural killer cells: Identification of a CD94/NKR-P1-related receptor in blood cells of Botryllus. Proceedings of the National Academy of Sciences Jan 2003, 100 (2) 622-627; DOI: 10.1073/pnas.0234104100


Friday, December 3, 2021

Flow cytometry I: Compensation

Put simply, as long as we don't find fluorochromes with absolute fidelity (i.e. very narrow emission peaks), we simply have to compensate raw readings from a flow cytometer. Let's start wth just two fluorochromes in two channels, 

1. Phycoerythrin (PE) in FL1 detector (red)

2. Fluorescein isothiocynate (FITC) in FL2 detector (yellow)

From a purely theoretical physics perspective, FITC and PE show a consistent and reproducible  overlap in their emission spectrum (from Spectra analyser; https://www.biolegend.com/en-us/spectra-analyzer)

Looking at the two emission spectrum (X axis is wavelength in nm), one can calculate how much FITC emission overlaps with PE, and vice versa; it is evident that FITC has a significant component where PE peak (red) is located, but PE does not have much of a tail where FITC (yellow) peaks

Usually flow cytometers have detector which detect light within a band of wavelengths, and they are calibrated to detect certain peaks. For example, a flow cytometer might have a red detector (FL1) and a yellow detector(FL2).
By simple eyeballing, one can guess that 15% of the red peak is contributed by the yellow tail, which is very close to the correct figure

Looking at the graph, we can guess that the emission peak of PE is augmented by 15% because of 'spillover' from FITC. This percentage is quite invariant in the abstract, ideal world of theoretical physics. In such an ideal world, for each cell which is interrogated by the flow cytometer, we can deduce the 'true' PE emission by the equation:
PEreal = PEobserved - (0.15 x FITCobserved)

The graph also shows a 1% contribution of PE in FITC peak (the remnant of the red tail in the yellow band). Thus,

FITCreal = FITCobserved - 0.01 x PEobserved

The two equations are simultaneous, i.e. they have two unknown variables PEreal and FITCreal, and thus can be solved (the flow cytometer has already provided you with PEobserved and FITCobserved). In general, for n fluorochromes to be detected by n bands, you will have n such equations; with a little linear algebra, you can manually solve them all (or ask your favorite Flow Cytometry analyser software to do it for you!). All you need is a ready made compensation matrix, which is an assortment of the correction factors in the form of an n x n table.
FITCPE
FITC10.15
PE0.011

Is that it?

Unfortunately, no. Flow cytometers are real instruments who measure real cells with real lasers and detectors, which are prone to voltage fluctuations, dead cell artifacts, and errors which simply can not be traced to a particular cause. Plus, each flow cytometer can have a different detector and different band pass. Thus, using the blanket values 15% & 1% is not advised. It is now routine to determine these values every time.
Now how do you do that? Spectrometry is not everyone's cup of tea. Fortunately, we can make an assumption that will make the task simpler: fluorescence intensity in a channel is the sum of contributions from all fluorochromes, in the same ratio in which their emission spectra overlap. That is to say, if I get an intensity x in the FL1 channel and y in FL2 channel, I can be sure that some fixed fraction of x is always contributing to y.
Determination of this correction factor, now, becomes a matter of designing an experiment. We prepare 
  1. a set of cells (C1) stained only with FITC combined with a diffusely positive marker (CD3)
  2. another set of cells (C2) stained only with PE tagged to the same CD3
Now let's run C1 in our flow cytometer, and plot FITC vs PE. Ensure that
  1. No part of the negative population does not go off the left of the chart, i.e. it must fully stay within the chart (adjust the voltage if necessary)
  2. The positive population is at least as positive as you would expect cells to be in your eventual experiment
  3. You don't use different cell lines (i.e. don't put lymphocytes in C1 and monocytes in C2; in such cases, better to use custom made beads which bind all IgG kappa antibodies for this purpose)
In this uncompensated graph, find the median fluorescence intensity (MFI) of both FITC and PE channel (although you haven't actually put PE in this tube, just FITC; whatever PE is showing is due to spill from FITC)

For example, let's say 
  • MFI_FITC_Pos = 80
  • MFI_FITC_Neg = 10
  • MFI_PE_Pos = 30
  • MFI_PE_Neg = 5

You can now make a few simple calculations
  • Let x = (MFI_PE_Pos - MFI_PE_Neg) = (30-5) = 25, which represents the effective MFI in PE channel
  • Let y = (MFI_FITC_Pos - MFI_FITC_Neg) = (80-10) = 70, which is the effective MFI in FITC channel
Now the factor x/y = 25/70 = 35% is the correction factor for spill of FITC into PE. You can now similarly calculate correction factor for spill of PE into FITC from the C2 tube.
Note that after compensation, the width of the FITC positive population will increase slightly; this is because the FITC information is now coming from two sources, both FITC and PE, thus increasing its error (degree of freedom); however, the median PE negative line (blue) must remain the same through both populations

With n fluorochromes, one can try n tubes with cells/ beads, each having a single fluorochrome, and acquire and plot them, and do the maths by hand, to come up with a compensation matrix. Or, you know, just let your favorite software do it magically.

Saturday, May 22, 2021

Antigen titration for T cell stimulation

T lymphocytes don't 'naturally' respond to an antigen; for an antigen to elicit a T cell response

1. A T cell clone with that particular receptor must be present

2. There must be antigen presenting cells (dendritic cells/ macrophages/ B cells)

In vitro, in isolated mononuclear cell preparations from whole blood, the second point is not usually a problem. However, the first condition, presence of antigen specific T cell clone, varies. 

For example, for a disease like tuberculosis which is very prevalent in India, one might expect that everyone has at least a few T cell clones for tubercular antigens. However, if the person has never got actual tuberculosis disease, this clone will not be very large. For rare diseases (like Scrub typhus), one would expect an even lower proportion of antigen specific T cells.

Empirically, it is prudent to do a titration of a specific antigen - if only to see which dose does the T cell respond the most. It is not a very tightly controlled experiment, because

1. The total number of lymphocytes vary between people

2. The size of antigen specific T cell clones vary between person to person

3. The T cell response is not dose dependent

However, like all biological phenomenon, T cell stimulation is not an 'all or none' phenomenon, and some correspondence with dose of antigen is always observed. In this case, a whole cell lysate of Mycobacterium tuberculosis (the antigen) was used in increasing doses to stimulate T cells from a healthy person. Production of interferon gamma (IFNG) was used as a marker for T cell response.

1. CD4+ T cells were selected (first panel): the anti-CD4 antibody is tagged with APC

2. The IFNG producing CD4+ T cells are shown in sequence, with increasing doses of the antigen producing a higher proportion of IFNG+ T cells

The unstimulated population is used as a control to create the box ('gate') for IFNG+ T cells

The proportion of IFNG+ T cells plateaus at 7.5 microL of antigen dose, and thus this dose was selected.

Thanks Uddeep & Dr Abhinav 


Sunday, April 11, 2021

Oxidative burst

Neutrophils (& monocytes) produce hydrogen peroxide (through superoxide production) to kill phagocytosed bacteria. 

2O2 + NADPH —> 2O2•– + NADP+ + H+

This reaction is catalaysed by NADPH oxidase. A series of reactions then generates hydrogen peroxide from this superoxide radical, and finally hypochlorous acid.

In vitro, this reaction can be visualised by Dihydrorhodamine (DHR), which is oxidised by H2O2 from normal, stimulated neurophils to give fluorescence (in the FITC channel). EDTA/ heparin blood must be used within 2 hours of collection, in room temparature all the time.

Gating neutrophils, lymphocytes and monocytes from whole blood

Before and after stimulation; note presence of DHR peak ('oxidative burst') in neutrophils and monocytes, and not in lymphocytes

The lack of superoxide produces a (weirdly named) disease.

Chronic granulomatous disease

Well, this has got (almost) nothing to do with granulomas (maybe a little, indrectly). This is a defect in several components of NADPH oxidase, resulting in inability to produce hydrogen peroxide. An X linked form (75%) & an autosomal recessive form (25%) occur.

Agent

XR: Mutation in phagocyte NAPH-O complex due to defect in gene for gp91phox.

AR: Defects in genes p47,67,22 phox or RAC2

It manifests as recurrent pyogenic infection with catalase +ve organisms.

Pathology

Three scenarios:

1. Normal neutrophils accumulate H2O2 in the phagosome containing ingested bacterium → MPO (myeloperoxidase) is delivered to the phagosome by degranulation, → H2O2 acts as a substrate for MPO to oxidize halide to hypochlorous acid and chloramines, which then kill the microbes. The quantity of hydrogen peroxide produced by normal neutrophils is sufficient to exceed the capacity of catalase, a hydrogen peroxide-catabolizing enzyme of many aerobic microorganisms.

2. When catalase +ve organisms such as E. coli gain entry into the CGD neutrophils, they are not exposed to hydrogen peroxide because the neutrophils do not produce it, and the hydrogen peroxide generated by microbes themselves is destroyed by their own catalase. Thus catalase-positive microbes, such as E. coli, can survive within the phagosome of the CGD neutrophil.

3. When CGD neutrophils ingest catalase negative organisms such streptococci or pneumococci, the organisms generate enough hydrogen peroxide to result in a microbicidal effect; i.e. they are killed by their own hydrogen peroxide.

(Ref: Williams, Hematology)

Thus there is a preponderane by recurrent infections by Catalse positive organisms.

CGD; note the lack of oxidative burst in stimulated neutrophils


Saturday, April 10, 2021

Foxp3

Titration of FoxP3 (tagged with PE). Note the gradual and slow population shift over increasing doses of antibody.  (UU - unstimulated unstained, US - unstimulated stained, SS - stimulated & stained)

As the dose of antibody is inreased, the entire helper T cell population is taking up the stain (which is unwanted behavior)

There is no drop in median PE expression with doses upto 10 microL. This means there might be yet more antibody targets left to bind


In this case, 2.5 miroL dose which gives good positive population (2.86%) without staining the negative population. So we select this dose.

Antibody clone: 236A/E7, FoxP3 - PE

Transforming growth factor beta 1

Titration of anti TGFB1 antibody

Without stimulation

Titration plots for increasing doses of anti-TGFB1. Note the vertical line drawn at unstained (UU) and successive population shifts (non specific binding?). The ideal dose in this case must be close to 0.625 microL.

Doses ranging from 0.625 to 10 microL; note that entire cell population is moving

Plotting median FITC versus dose shows a continuously increasing trend. so no help from there!

With antigenic (MTb) stimulation

Does not make much of a difference


Thus, still undecided on the dose.

(Antibody clone TW4-9E7 bound to Alexa fluor 488, detected on FITC channel; cells - healthy peripheral blood mononuclear cells).


Tuesday, February 23, 2021

Titrating antibodies for flow cytometry

To determine the optimal dose of an antibody (which will bind cells at just the right proportion to generate a signal which is measurable within the limits of the lasers of the machine) is an exercise in perseverence. One must prepare serial dilutions of the antibody, isolate cells from blood (in this case, lymphocytes) and go on staining with each dilution of antibodies. 

Here, anti human FoxP3 has been prepared at doses of 5, 2.5, 1.25 and 0.625 microL (to stain one million cells, in each case). FoxP3 is a transcription factor expressed by a select set of T lymphocyte only upon stimulation by some external antigen. The graphs show staining intensity of the fluorochrome (in this case, phycoerythrin) as a histogram of cell counts, indicating expressionof FoxP3 inside the cells. Shift in median staining intensity has started to appear from 2.5 microL onwards. Note the difference between
  • peaks of unstained cells (blue) and unstimulated cells (green), as expected
  • peaks of stained cells, with increasing concentrations of antibodies, shown in progressively redder colors

The axis is logarithmic, so the differences between peaks are really much more than they seem

... as evident from the mean and median statistics (see legend of plot)

IL-17, the cytokine of acute inflammation, shows only a moderate increasewith stimulation.
Without stimulation, without staining for any antibody
Without stimulation, but with staining for any background IL-17 present

With stimulation; note the scattered points towards far right (high IL-17 expression)
With a constitutive surface marker like CD4, there is hardly any difference between unstimulated and stimulated
Orange - unstimulated, stained for CD4, green - stimulated and stained, purple- neither stimulated nor stained for CD4


Thanks Uddeep and Dr Abhinav Saurabh

Sunday, February 7, 2021

Visualising cytokines

Cytokine production by cytotoxic T cells

T cells stimulated with tubercular antigen show a visible increase in the proportion of interferon-gamma producing CD8+ T cells; (flow cytometric data, PE Cy5 = CD8, FITC = IFN gamma)

Before stimulation; note the very small fraction of cells above the horizontal line (i.e. those producing interferon)


After stimulation; 2-4 % of cells have now been activated and moved above the line

The CD8 negative cell population (i.e. left of the vertical line) are a mix of B cells and helper (CD4+) T cells; note that CD4+ T cells will also produce interferons, as seen in the top left quadrant.

Column chromatography

 A jar of snacks (namkeens) demonstrate the principles of column chromatography to a fairly accurate extent. In a column consisting of diffe...